Improving build of open source projects Part #1 - profiling
What does a real contributor's CI actually run before tests even start? I pulled the exact commands from GitHub Actions and profiled them, two different ways, on three open-source projects.
What actually slows down waiting for CI? Not an idealized ./gradlew build I made up myself — the exact command a real contributor’s pull request sits behind before a single test runs.
So I went and found it. For SonarQube, Kafka, and Groovy, I pulled a real GitHub Actions run for each, used gh api to find the exact job and workflow file behind it, and extracted the literal Gradle invocation their own CI runs as a prerequisite to testing. Then I profiled that command two different ways. Three very different codebases, three very different reasons their builds are slow — and a second pass, looking at a completely different signal, told a different story again.
Method, briefly
Finding the real commands. gh api repos/<org>/<repo>/actions/jobs/<id> gives you the step list for a specific CI run; cross-referencing that against the workflow YAML (gh api repos/<org>/<repo>/contents/.github/workflows/...) gives you the literal shell command behind each step. That’s not a guess — it’s what actually ran on that PR:
- Kafka (
build.yml, job “Compile and Check”):./gradlew --build-cache --info --scan check releaseTarGz -x test - Groovy (
groovy-build-test.yml, job “lts (17, windows-latest)”):./gradlew test -Pgroovy.grape.bridge-cache=true -Ptarget.java.home=... - SonarQube (a shared
SonarSource/ci-github-actions/build-gradleaction,build.sh):./gradlew --no-daemon --stacktrace --console plain build [-x test] sonar ... artifactoryPublish ...
On top of each, three fixed policy additions regardless of what the project’s own CI does: clean first; --no-build-cache (the whole point of a profiling pass is a clean number, and CI’s own cache is exactly the kind of thing that produced a wrong result here once already — more below); and skip test execution, since tests are their own topic for a later post. --continue turned out to be necessary on all three — these are older, pinned release tags, and formatters/JDKs/checksums have drifted since they were cut, so each one now fails a check task for reasons that have nothing to do with build speed. Without --continue, Gradle stops at the first failure and most of the graph never runs.
One correction mid-investigation: Groovy’s real CI command is just ./gradlew test ... — nothing else requested alongside it. Appending -x test to that removes the entire graph, because nothing else asks for test’s dependencies once test itself is excluded — Gradle never builds what nobody’s asking for. First attempt at this came back as an 8-task, 2-second no-op. The honest equivalent of “build what tests need, don’t run them” is requesting testClasses directly, so that’s what’s actually behind every Groovy chart below.
Final commands, run one project at a time (all three on one 12-core machine at once caused real contention the first time — one measurement came back 10× inflated):
- SonarQube:
./gradlew clean && ./gradlew --no-daemon --stacktrace --console plain build -x test --no-build-cache --continue - Kafka:
./gradlew clean && ./gradlew check releaseTarGz -x test --no-build-cache --continue - Groovy:
./gradlew clean && ./gradlew testClasses -Pgroovy.grape.bridge-cache=true --no-build-cache --continue
Two different profiles, from the same run. Gradle’s --profile flag gives per-task durations, grouped here by task type (compileJava, checkstyleMain, zip, …) summed across every module, rolled into eight buckets: Compile, Test compile, Style checks, Static analysis, Documentation, Code generation, Packaging, Other. That answers “where does the effort go” — but on a multi-module build, effort and wall-clock time are different questions, since independent modules build concurrently. For the second question — what’s actually forced to happen in sequence — a small Gradle init script (TaskExecutionGraph.getDependencies() for real dependency edges, beforeTask/afterTask for real timestamps) captures everything needed to compute a genuine critical path: the classic critical-path method, longest duration-weighted chain through the dependency graph, no external build-scan service required.
SonarQube: compile leads, but packaging is real now
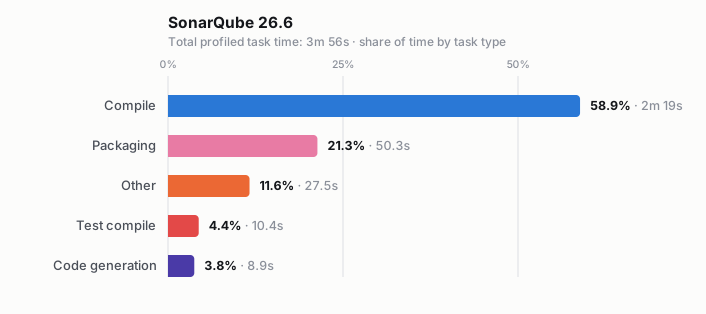
./gradlew clean && ./gradlew --no-daemon --stacktrace --console plain build -x test --no-build-cache --continue
Running the actual CI command in full — no shortcuts, no excluded modules — 58.9% of SonarQube’s profiled time is still straight Java compilation. But Packaging is now a real 21.3%, not the near-zero it was when an earlier pass here artificially skipped the module that builds the installer. That bucket is the SonarQube distribution coming together for real: sonar-application’s shadow jar, its final zip, and the JREs it bundles for six platforms. “Other” (11.6%) is mostly a software bill-of-materials scan (cyclonedxDirectBom) plus those JRE downloads — network I/O, not CPU, but real wall-clock time either way.
Kafka: static analysis is still the bottleneck, not code
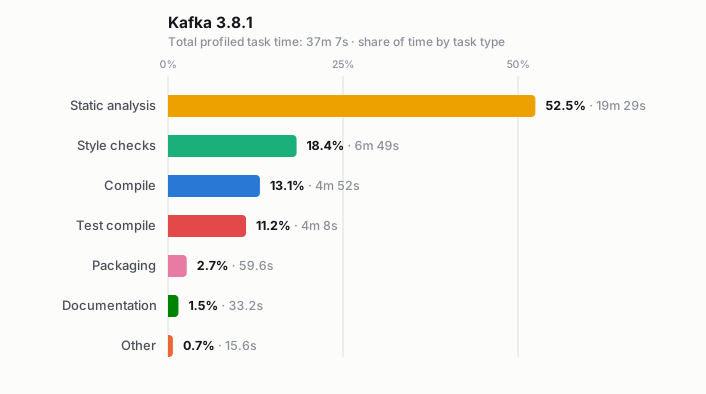
./gradlew clean && ./gradlew check releaseTarGz -x test --no-build-cache --continue
Barely moved from an earlier pass, and for the same reason: SpotBugs alone (52.5%) still outweighs compilation (13.1%) by 4×. Style checks (18.4%, Checkstyle plus Scala’s Spotless formatter — the real CI command runs both) push verification tooling past 70% of the total. releaseTarGz, the task this whole investigation was chasing, turns out to be a rounding error on its own (2.7%) — its cost is almost entirely the compile-and-check work that has to happen before it, not the archiving step itself. A new sliver, Documentation (1.5%), shows up now too: releaseTarGz pulls in dozens of tiny gen*Docs tasks (protocol docs, config docs, metrics docs) that never appeared in a check-only profile.
Groovy: without the docs, it’s just compilation
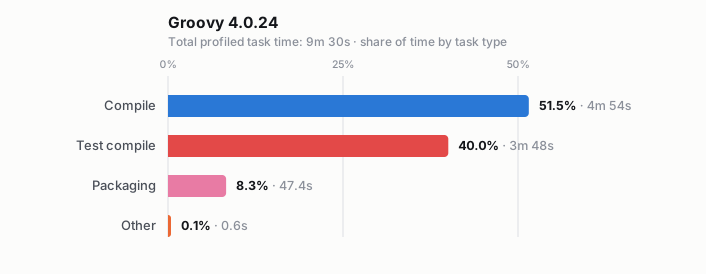
./gradlew clean && ./gradlew testClasses -Pgroovy.grape.bridge-cache=true --no-build-cache --continue
This is the chart the methodology fix actually changes the meaning of. testClasses never touches Javadoc, Groovydoc, Asciidoctor, or Checkstyle — those were never part of “getting ready for tests” to begin with, they were an artifact of profiling the full build task instead of what CI runs before testing. Strip them out and Groovy’s real pre-test build is compilation, full stop: 51.5% compiling main sources, 40.0% compiling test sources, 8.3% packaging the intermediate jars each module needs before the next one can compile against it. No mystery bottleneck — just a lot of Groovy code to compile, twice (once as main, once as test).
What actually slows down the feedback loop
The reason this whole exercise exists is a developer sitting in front of a pull request, waiting on CI to go green — and, increasingly, an AI agent doing the same thing in a loop, where a slow feedback cycle costs even more than it does for a human. What that wait actually feels like isn’t “where does the effort go” — it’s “what determines the wall-clock time,” and those are different questions. Aggregate time answers the first one. Answering the second needs the real dependency edges and real timestamps, not just durations summed by type.
SonarQube: the real critical path ends in an actual archiving task
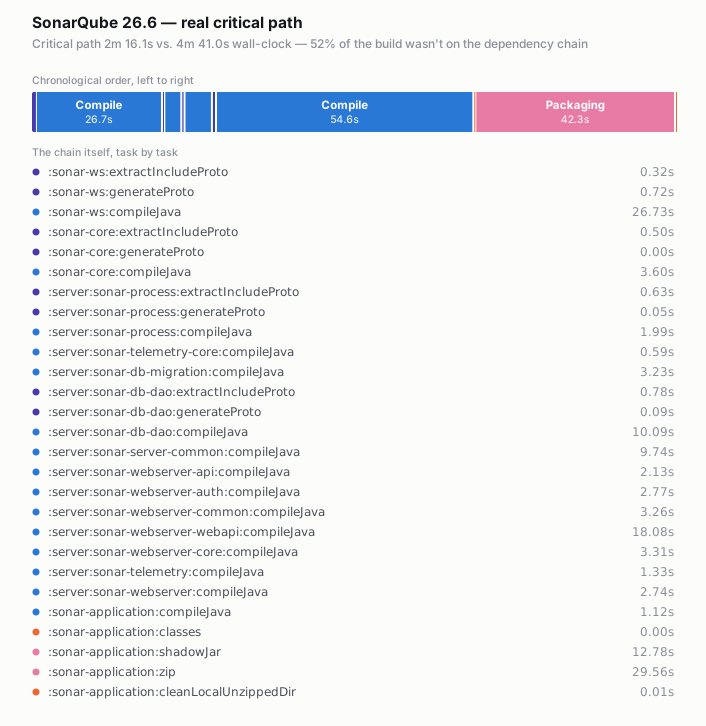
./gradlew clean && ./gradlew --no-daemon --stacktrace --console plain build -x test --no-build-cache --continue --init-script capture-graph.init.gradle -PdepGraphOut=...
The real critical path is 2 minutes 16 seconds; the build takes 4 minutes 41. 52% of the wall-clock time still isn’t on any dependency chain — the same parallelism-headroom finding as before (org.gradle.parallel isn’t set), and this time it holds up honestly, not as an artifact of a cache bug. What’s new is how the chain ends: 27 real steps of module-feeding-module compilation, the same shape as last time, but now followed by :sonar-application:shadowJar (12.8s) and then :sonar-application:zip (29.6s) — the actual installer archive, built single-threaded, for real. Nearly a third of this critical path is one archiving task at the very end.
Kafka: already running near its floor
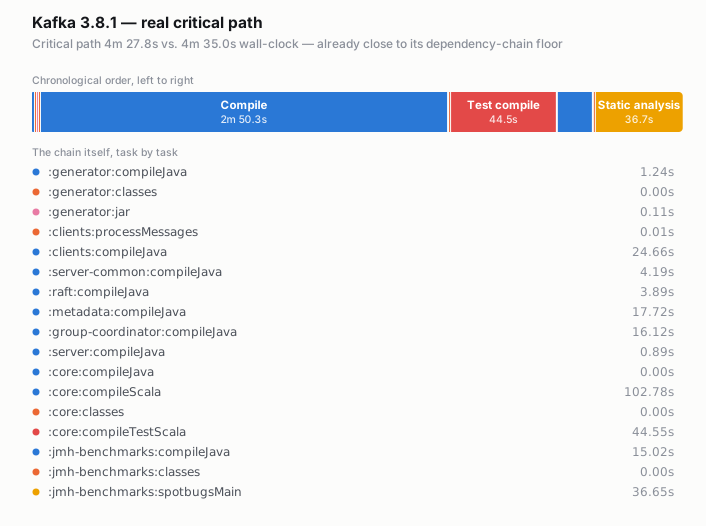
./gradlew clean && ./gradlew check releaseTarGz -x test --no-build-cache --continue --init-script capture-graph.init.gradle -PdepGraphOut=...
Kafka’s critical path (4m 27.8s) is almost identical to its wall-clock time (4m 35s) — org.gradle.parallel=true is already extracting nearly everything this dependency graph allows, same as before. :core:compileScala (102.8s) is still the single biggest link, not SpotBugs; the one SpotBugs instance that does gate the finish line, :jmh-benchmarks:spotbugsMain (36.7s), is the tail end of the chain, not the reason for it. The aggregate chart says static analysis is the bottleneck; the real chain says a single Scala compile is, because it’s the one instance with nothing to run in parallel with it.
Groovy: no slack left at all
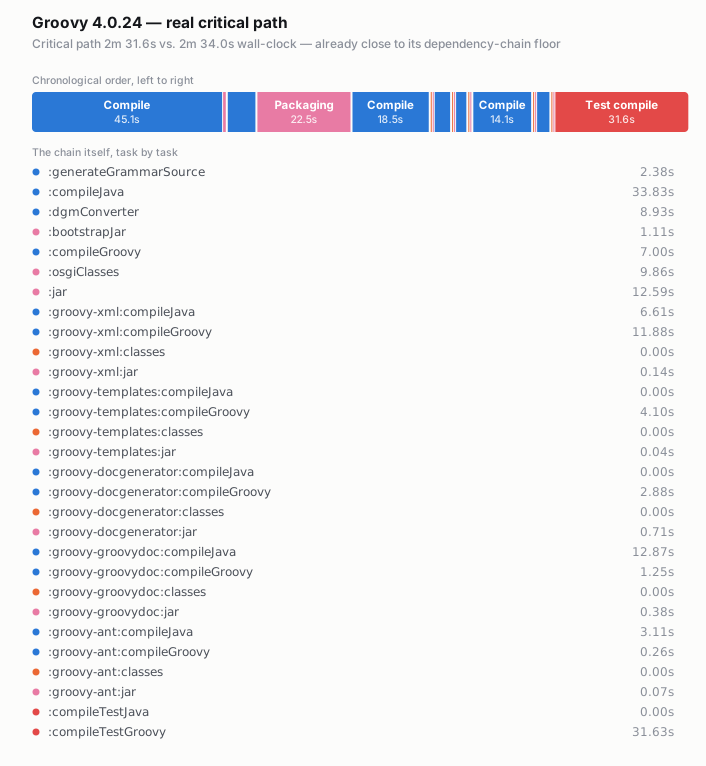
./gradlew clean && ./gradlew testClasses -Pgroovy.grape.bridge-cache=true --no-build-cache --continue --init-script capture-graph.init.gradle -PdepGraphOut=...
This flips completely from the last version of this chart, and for a good reason: that version profiled full build, and its critical path was one dependency-free PDF-rendering task that happened to be enormous. testClasses never touches that task, so the real pre-test critical path looks nothing like it — it’s a genuine 29-step chain through module after module (groovy-xml → groovy-templates → groovy-docgenerator → groovy-groovydoc → groovy-ant → the root’s own compileTestGroovy), each waiting on the last because that’s really how they depend on each other. And unlike SonarQube, there’s almost no headroom left: 2m 31.6s of critical path against a 2m 34s build, a 1.6% gap. Whatever’s slow about getting Groovy ready for tests, it isn’t unused parallelism — the dependency graph itself is the constraint, and shortening it means restructuring which module depends on which, not flipping a flag.
Where all three builds spend their time, combined
Every chart above is about one project at a time. Add up the raw --profile numbers across all three — SonarQube’s 235.9s, Kafka’s 2226.6s, Groovy’s 570.5s, 50 minutes 33 seconds of combined machine time — grouped by literal Gradle task type instead of project, and a different question gets answered: not “what’s slow in project X” but where a small fleet of real-world Gradle builds actually burns compute.
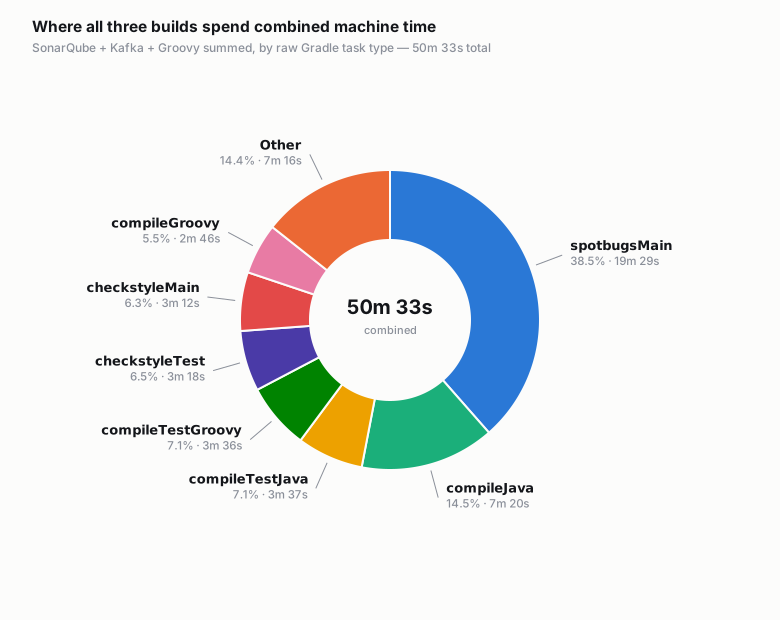
Derived from the three profiled runs above, summed by raw task type (not a single command)
Compilation is not the answer by itself. A single static-analysis task type, SpotBugs, is 38.5% of all three builds’ combined time — bigger than any other individual task type, and it only runs in one of the three projects. Add every compile-flavored task together — compileJava, compileGroovy, compileScala, compileTestJava, compileTestGroovy, compileTestScala, and their smaller cousins — and the total lands around 40%, close enough to SpotBugs alone to call it a tie. Checkstyle (checkstyleMain + checkstyleTest, also Kafka-only here) is another 12.8%.
And the archiving work this whole series keeps circling back to — zip, jar, shadowJar, copyDependantLibs, osgiClasses, releaseTarGz combined — comes to about 127 seconds. 4.2% of the total, sitting quietly inside that 14.4% “Other” wedge. Across this sample, whatever’s expensive about a Gradle CI build is compiling and analyzing code — not zipping it up.
Three commands, three real answers
Same method applied honestly this time — the exact command each project’s CI runs, not a stand-in for it. SonarQube is still compile-heavy in aggregate but has real, uncorrupted packaging and parallelism-headroom findings once the full command runs. Kafka didn’t move: static analysis dominates the totals, a single Scala file dominates the real chain, both true, same as before. Groovy changed the most, because asking the right question (what do tests actually need) changed which tasks were even in scope — the aggregate chart went from “documentation pipeline” to “compile twice,” and the critical path went from “one enormous dependency-free task” to “a tight chain with no slack anywhere.”
That’s still the point of profiling before optimizing: there’s no generic “CI is slow” fix, and there’s no single command you can guess your way into that answers it for you — you have to go find the one that actually ran. Part 2 will pick one of these three and go after the actual bottleneck.